Typical final
ODU 70, UVA 76
Spread and total: game
ODU +7.554%46%UVA -7.5
ODU +6.552%48%UVA -6.5
ODU +5.550%51%UVA -5.5
ODU +4.547%53%UVA -4.5
ODU +3.545%55%UVA -3.5
O 142.554%46%U 142.5
O 144.552%48%U 144.5
O 146.549%51%U 146.5
O 148.547%54%U 148.5
O 150.544%56%U 150.5
1st half (score at halftime)
ODU +4.555%46%UVA -4.5
ODU +3.552%48%UVA -3.5
ODU +2.549%51%UVA -2.5
ODU +1.546%54%UVA -1.5
ODU +0.544%56%UVA -0.5
O 69.558%42%U 69.5
O 71.554%46%U 71.5
O 73.549%51%U 73.5
O 75.544%56%U 75.5
O 77.540%60%U 77.5
From 10,000 simulated games.
| Players to watch | PTS | REB | AST | Chance |
|---|
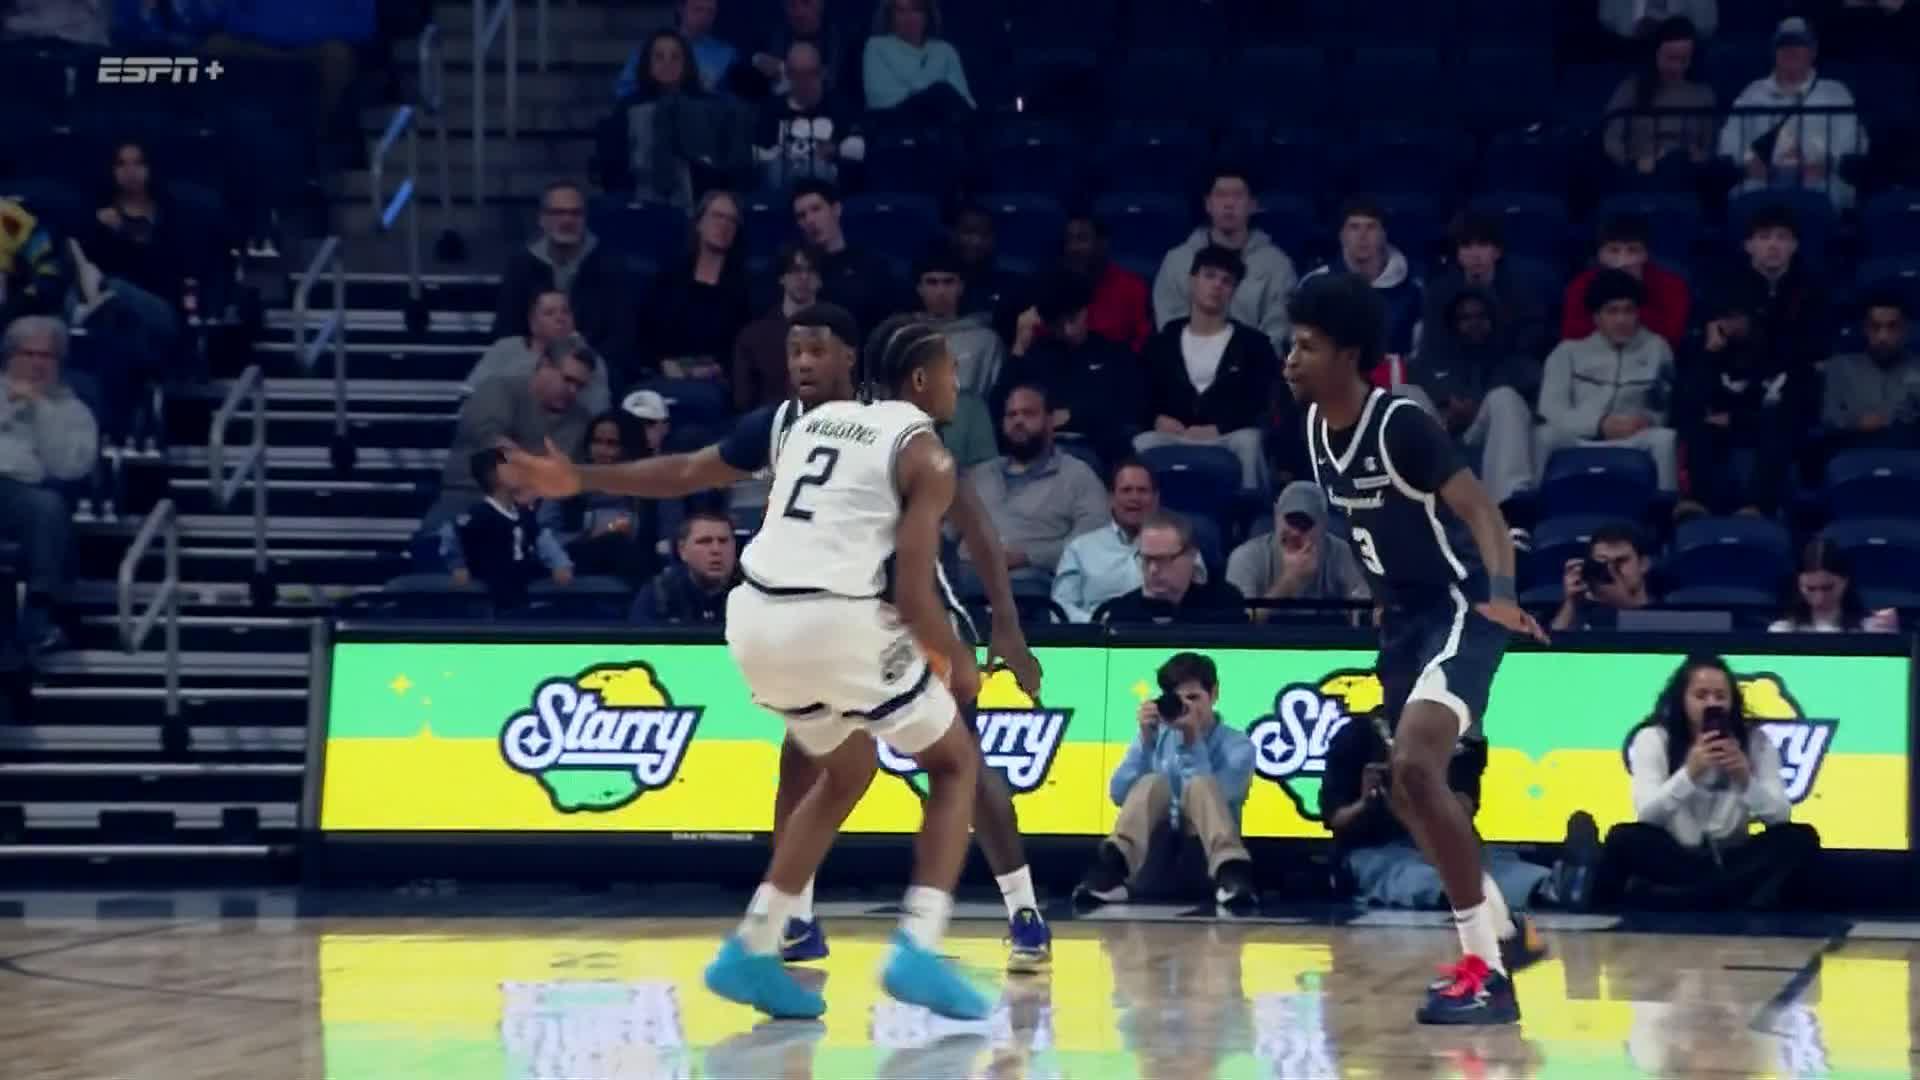
| ODUZacch Wiggins | 14.4 | 4.7 | 2.3 | 15+ 47% |
| UVAThijs De Ridder | 13.8 | 7.3 | 1.4 | 15+ 42% |
| UVASam Lewis | 13.6 | 4.5 | 1.3 | 15+ 41% |
| UVAJohann Grunloh | 12.1 | 6.6 | 1.2 | 15+ 29% |
| UVAChance Mallory | 11.2 | 3.4 | 3.3 | 15+ 24% |
| ODUAdante' Holiman | 11.0 | 0.8 | 1.9 | 10+ 58% |
Old Dominion simulated box score
| Player | MIN | PTS | REB | AST | STL | BLK | TO | FG | 3PT | FT |
|---|
| Zacch Wiggins | 33 | 14.4 | 4.7 | 2.3 | 1.4 | 0.6 | 2.3 | 4.8-11.2 | 1.3-4.4 | 3.5-4.7 |
| Adante' Holiman | 27 | 11.0 | 0.8 | 1.9 | 0.8 | 0.0 | 1.7 | 3.9-10.3 | 2.1-6.7 | 1.2-1.6 |
| Bubu Benjamin | 24 | 9.4 | 2.5 | 1.6 | 1.3 | 0.3 | 1.7 | 3.3-8.6 | 1.4-4.6 | 1.3-1.8 |
| Jared Turner | 24 | 5.9 | 6.2 | 0.5 | 0.6 | 0.1 | 0.8 | 2.3-5.7 | 1.1-3.2 | 0.2-0.3 |
| Khoi Thurmon | 18 | 6.3 | 1.6 | 3.6 | 1.1 | 0.1 | 1.5 | 2.2-5.5 | 0.7-2.1 | 1.1-1.7 |
| Zamoku Weluche-Ume | 18 | 5.9 | 5.0 | 0.7 | 0.7 | 0.4 | 1.9 | 2.2-5.1 | 0.4-1.4 | 1.0-1.6 |
| Kylan Howze | 18 | 5.5 | 5.1 | 1.2 | 0.4 | 0.7 | 1.1 | 1.8-3.7 | 0.2-0.7 | 1.7-2.4 |
| Jotham Nweke | 18 | 4.5 | 3.8 | 0.2 | 0.6 | 1.2 | 1.3 | 1.5-3.5 | 0.4-1.2 | 1.1-1.6 |
| Scottie Hubbard | 11 | 3.6 | 2.1 | 0.4 | 0.3 | 0.0 | 0.5 | 1.2-3.2 | 0.5-1.6 | 0.6-0.8 |
| Cj Harper | 5 | 1.9 | 0.6 | 0.0 | 0.0 | 0.0 | 0.4 | 0.7-1.7 | 0.2-0.6 | 0.3-0.4 |
| CJ Lyons | 5 | 2.0 | 0.4 | 0.8 | 0.2 | 0.0 | 0.4 | 0.7-1.8 | 0.2-0.8 | 0.3-0.4 |
| Team | 200 | 70.4 | 32.8 | 13.2 | 7.4 | 3.4 | 13.6 | 24.6-60.3 | 8.5-27.3 | 12.3-17.3 |
Virginia simulated box score
| Player | MIN | PTS | REB | AST | STL | BLK | TO | FG | 3PT | FT |
|---|
| Sam Lewis | 31 | 13.6 | 4.5 | 1.3 | 0.9 | 0.3 | 3.3 | 4.7-10.8 | 1.6-4.8 | 2.7-3.4 |
| Johann Grunloh | 30 | 12.1 | 6.6 | 1.2 | 0.5 | 2.0 | 1.6 | 3.9-8.5 | 0.8-2.5 | 3.5-5.0 |
| Chance Mallory | 29 | 11.2 | 3.4 | 3.3 | 2.0 | 0.0 | 2.7 | 3.6-8.8 | 1.5-4.5 | 2.5-3.5 |
| Thijs De Ridder | 27 | 13.8 | 7.3 | 1.4 | 1.8 | 0.3 | 1.6 | 5.3-11.2 | 1.1-3.2 | 2.1-3.1 |
| Nolan Adekunle | 24 | 6.1 | 2.8 | 1.5 | 1.0 | 0.1 | 0.1 | 2.1-5.2 | 1.0-2.9 | 0.9-1.3 |
| Elijah Gertrude | 17 | 6.2 | 2.4 | 1.9 | 1.1 | 0.4 | 1.0 | 2.1-4.9 | 0.8-2.3 | 1.3-2.0 |
| Kalu Anya | 14 | 3.4 | 2.0 | 1.7 | 0.3 | 0.1 | 0.3 | 1.1-2.6 | 0.3-1.1 | 0.9-1.3 |
| Martin Carrere | 11 | 3.2 | 2.9 | 0.7 | 0.0 | 0.1 | 0.4 | 1.3-2.9 | 0.3-1.0 | 0.4-0.5 |
| Jurian Dixon | 9 | 3.7 | 1.2 | 0.7 | 0.4 | 0.0 | 0.4 | 1.4-3.3 | 0.5-1.5 | 0.5-0.7 |
| Jan Vide | 7 | 2.5 | 1.3 | 0.9 | 0.2 | 0.0 | 0.4 | 1.0-2.2 | 0.2-0.6 | 0.4-0.6 |
| Team | 200 | 75.8 | 34.4 | 14.6 | 8.2 | 3.3 | 11.8 | 26.5-60.4 | 8.1-24.4 | 15.2-21.4 |
Every possession played out from each team's shooting, turnovers, rebounding and pace and each player's minutes and usage, 10,000 times. Early season: leans on last season until teams have a few weeks of games.


 ODUUVA

















 ODU
