Typical final
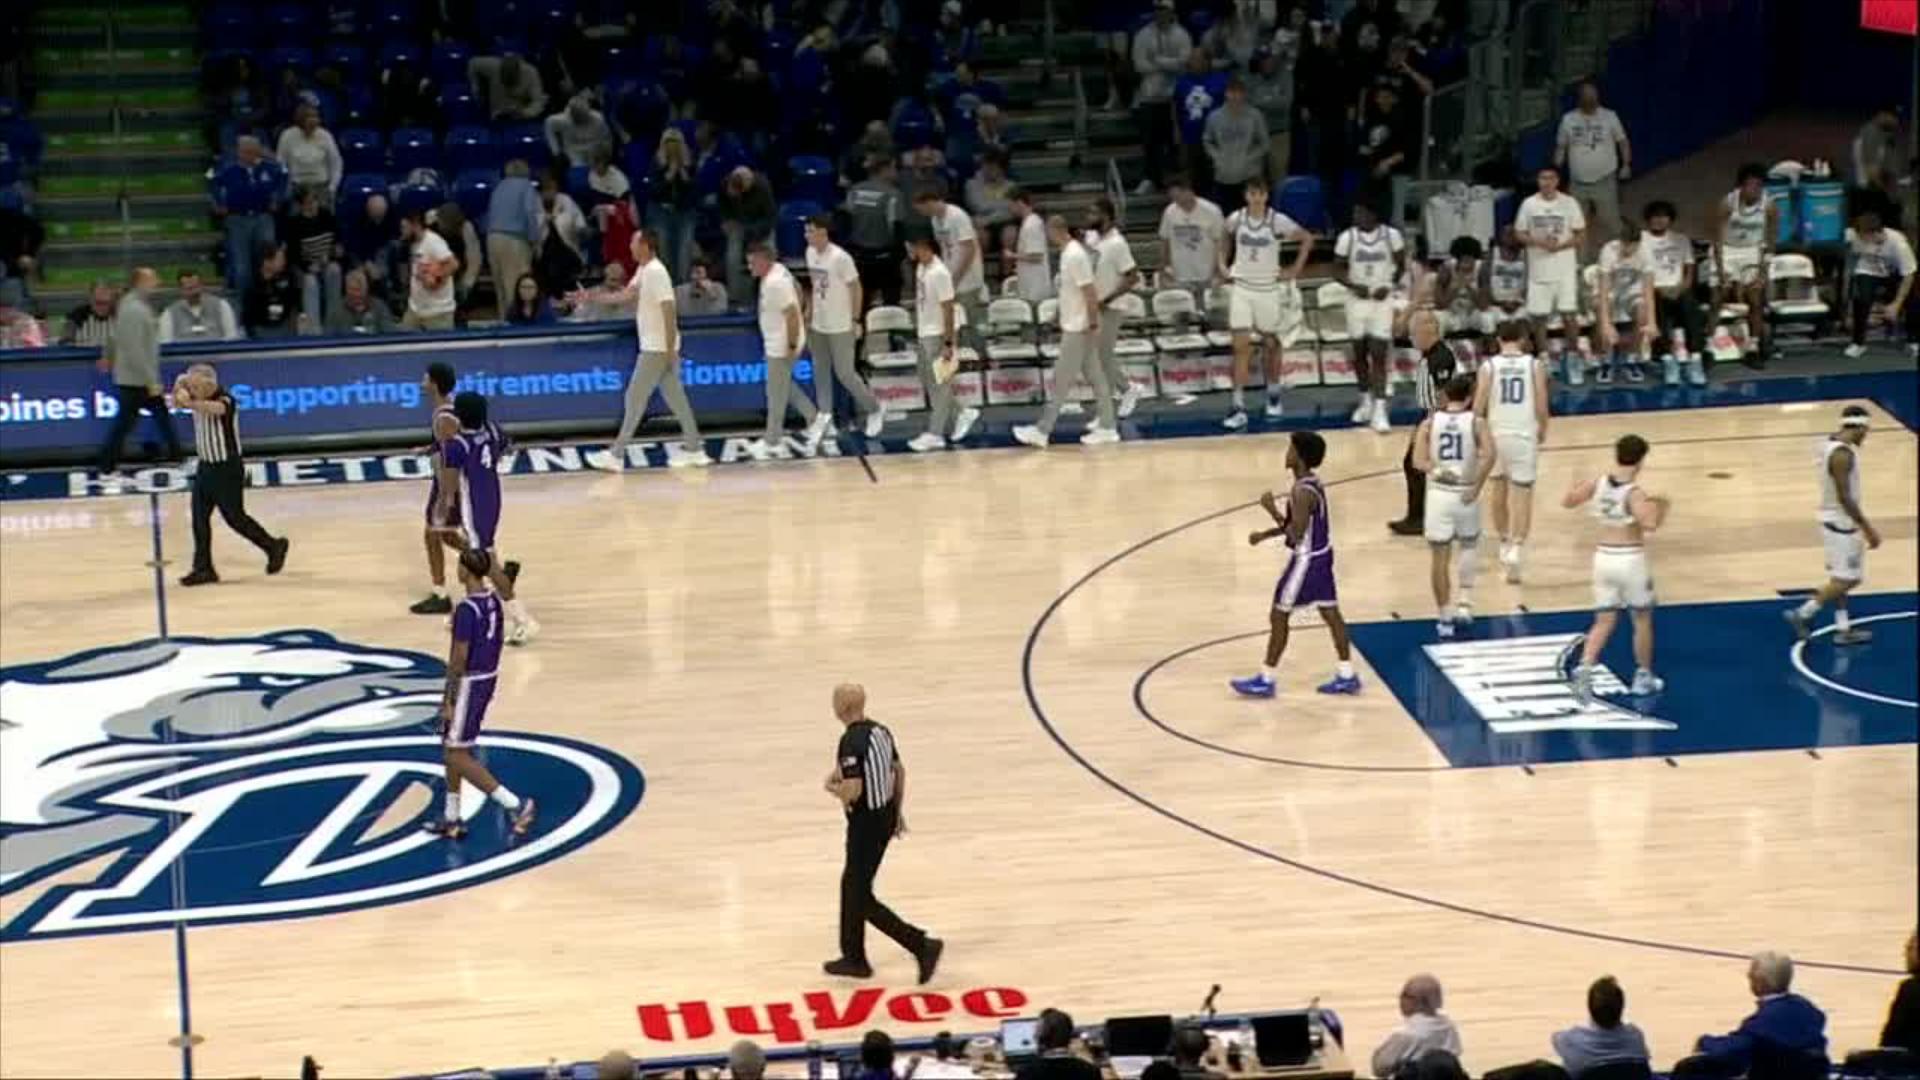
COFC 78, DRKE 77
Spread and total: game
COFC +0.553%47%DRKE -0.5
COFC -0.553%47%DRKE +0.5
COFC -1.551%50%DRKE +1.5
COFC -2.548%52%DRKE +2.5
COFC -3.546%54%DRKE +3.5
O 150.555%45%U 150.5
O 152.552%48%U 152.5
O 154.550%50%U 154.5
O 156.547%53%U 156.5
O 158.545%55%U 158.5
1st half (score at halftime)
COFC +1.555%45%DRKE -1.5
COFC +0.553%48%DRKE -0.5
COFC -0.550%50%DRKE +0.5
COFC -1.547%53%DRKE +1.5
COFC -2.545%55%DRKE +2.5
O 73.559%41%U 73.5
O 75.554%46%U 75.5
O 77.549%51%U 77.5
O 79.545%55%U 79.5
O 81.540%60%U 81.5
From 10,000 simulated games.
| Players to watch | PTS | REB | AST | Chance |
|---|
| DRKEJon Carroll | 15.9 | 7.3 | 0.8 | 15+ 58% |
| DRKEDre Kindell | 13.1 | 2.4 | 3.1 | 15+ 37% |
| COFCTavari Johnson | 12.8 | 1.9 | 2.6 | 15+ 36% |
| DRKEOwen Larson | 12.2 | 2.1 | 2.8 | 15+ 32% |
| COFCBen Bradford | 11.5 | 3.1 | 1.0 | 15+ 26% |
| COFCXavier Abreu | 8.2 | 2.3 | 0.7 | 10+ 35% |
Charleston simulated box score
| Player | MIN | PTS | REB | AST | STL | BLK | TO | FG | 3PT | FT |
|---|
| Tavari Johnson | 25 | 12.8 | 1.9 | 2.6 | 0.7 | 0.2 | 2.9 | 4.8-10.4 | 1.9-5.1 | 1.3-1.8 |
| Max Green | 23 | 8.1 | 3.4 | 1.2 | 1.2 | 0.2 | 1.0 | 2.3-5.5 | 0.9-2.9 | 2.5-3.3 |
| Ben Bradford | 23 | 11.5 | 3.1 | 1.0 | 1.2 | 0.2 | 1.5 | 3.7-8.0 | 1.1-3.2 | 3.0-4.1 |
| Eli Ellis | 21 | 7.1 | 3.3 | 1.9 | 0.5 | 0.3 | 0.9 | 2.7-5.9 | 0.9-2.6 | 1.0-1.4 |
| Braden Pierce | 19 | 6.4 | 3.6 | 1.5 | 0.6 | 1.8 | 0.7 | 2.5-5.4 | 0.5-1.4 | 0.8-1.3 |
| Xavier Abreu | 17 | 8.2 | 2.3 | 0.7 | 0.6 | 0.0 | 1.1 | 3.1-6.6 | 0.8-2.5 | 1.1-1.6 |
| Martin Kalu | 15 | 5.7 | 3.9 | 0.5 | 0.7 | 0.0 | 1.2 | 1.6-3.6 | 0.4-1.3 | 2.0-2.8 |
| Kobe Edwards | 13 | 4.4 | 1.6 | 1.4 | 0.6 | 0.4 | 0.1 | 1.5-3.2 | 0.4-1.3 | 0.9-1.4 |
| JaShawn Ladd | 13 | 3.7 | 2.2 | 1.0 | 0.4 | 0.4 | 0.9 | 1.1-2.5 | 0.4-1.1 | 1.1-1.6 |
| Will Mortimore | 12 | 4.2 | 2.7 | 1.1 | 0.7 | 0.0 | 1.1 | 1.2-2.4 | 0.2-0.7 | 1.6-2.4 |
| Nicolo Virginio | 7 | 2.2 | 2.4 | 0.4 | 0.2 | 0.0 | 0.5 | 0.9-2.0 | 0.3-0.9 | 0.1-0.2 |
| Trey Scott | 7 | 2.0 | 1.3 | 0.4 | 0.1 | 0.1 | 0.4 | 0.8-1.8 | 0.2-0.7 | 0.1-0.2 |
| Djordje Curcic | 5 | 1.8 | 0.2 | 0.6 | 0.0 | 0.0 | 0.1 | 0.6-1.4 | 0.2-0.6 | 0.3-0.5 |
| Team | 200 | 78.1 | 31.9 | 14.3 | 7.5 | 3.6 | 12.4 | 26.8-58.7 | 8.2-24.3 | 15.8-22.6 |
Drake simulated box score
| Player | MIN | PTS | REB | AST | STL | BLK | TO | FG | 3PT | FT |
|---|
| Owen Larson | 31 | 12.2 | 2.1 | 2.8 | 0.8 | 0.0 | 2.2 | 4.3-11.0 | 2.1-6.4 | 1.6-2.2 |
| Dre Kindell | 31 | 13.1 | 2.4 | 3.1 | 1.3 | 0.0 | 2.6 | 4.0-9.7 | 1.6-5.0 | 3.4-4.8 |
| Jon Carroll | 27 | 15.9 | 7.3 | 0.8 | 1.7 | 0.4 | 2.3 | 5.7-11.4 | 0.5-1.5 | 4.0-6.2 |
| Justin Burns | 24 | 6.4 | 5.3 | 1.0 | 0.7 | 0.9 | 1.2 | 2.2-4.8 | 0.4-1.1 | 1.6-2.5 |
| Eli Shetlar | 21 | 6.9 | 3.2 | 1.4 | 0.5 | 0.3 | 0.4 | 2.4-6.5 | 1.3-4.1 | 0.8-1.1 |
| Andrew Alia | 20 | 5.5 | 3.9 | 0.9 | 0.4 | 0.0 | 0.6 | 2.0-4.9 | 0.8-2.5 | 0.7-1.0 |
| Griffen Goodbary | 12 | 3.3 | 3.0 | 0.8 | 0.2 | 0.3 | 1.2 | 1.1-2.6 | 0.2-0.7 | 0.8-1.2 |
| Bryson Bahl | 11 | 5.4 | 1.0 | 1.0 | 0.5 | 0.6 | 0.3 | 1.5-3.8 | 0.7-2.0 | 1.6-2.2 |
| Dothan Ijadimbola | 9 | 3.3 | 2.3 | 1.8 | 0.9 | 0.0 | 0.5 | 1.3-2.8 | 0.2-0.8 | 0.5-0.8 |
| LJ Rush | 7 | 2.6 | 1.8 | 0.3 | 0.5 | 0.6 | 0.9 | 0.6-1.4 | 0.2-0.5 | 1.2-1.8 |
| Gabe Oldham | 7 | 2.1 | 1.6 | 0.2 | 0.2 | 0.1 | 0.3 | 0.7-1.6 | 0.1-0.4 | 0.5-0.8 |
| Team | 200 | 76.7 | 33.9 | 14.1 | 7.7 | 3.2 | 12.5 | 25.8-60.5 | 8.1-25.0 | 16.7-24.6 |
Every possession played out from each team's shooting, turnovers, rebounding and pace and each player's minutes and usage, 10,000 times. Early season: leans on last season until teams have a few weeks of games.


 COFCDRKE















 COFC
