Typical final
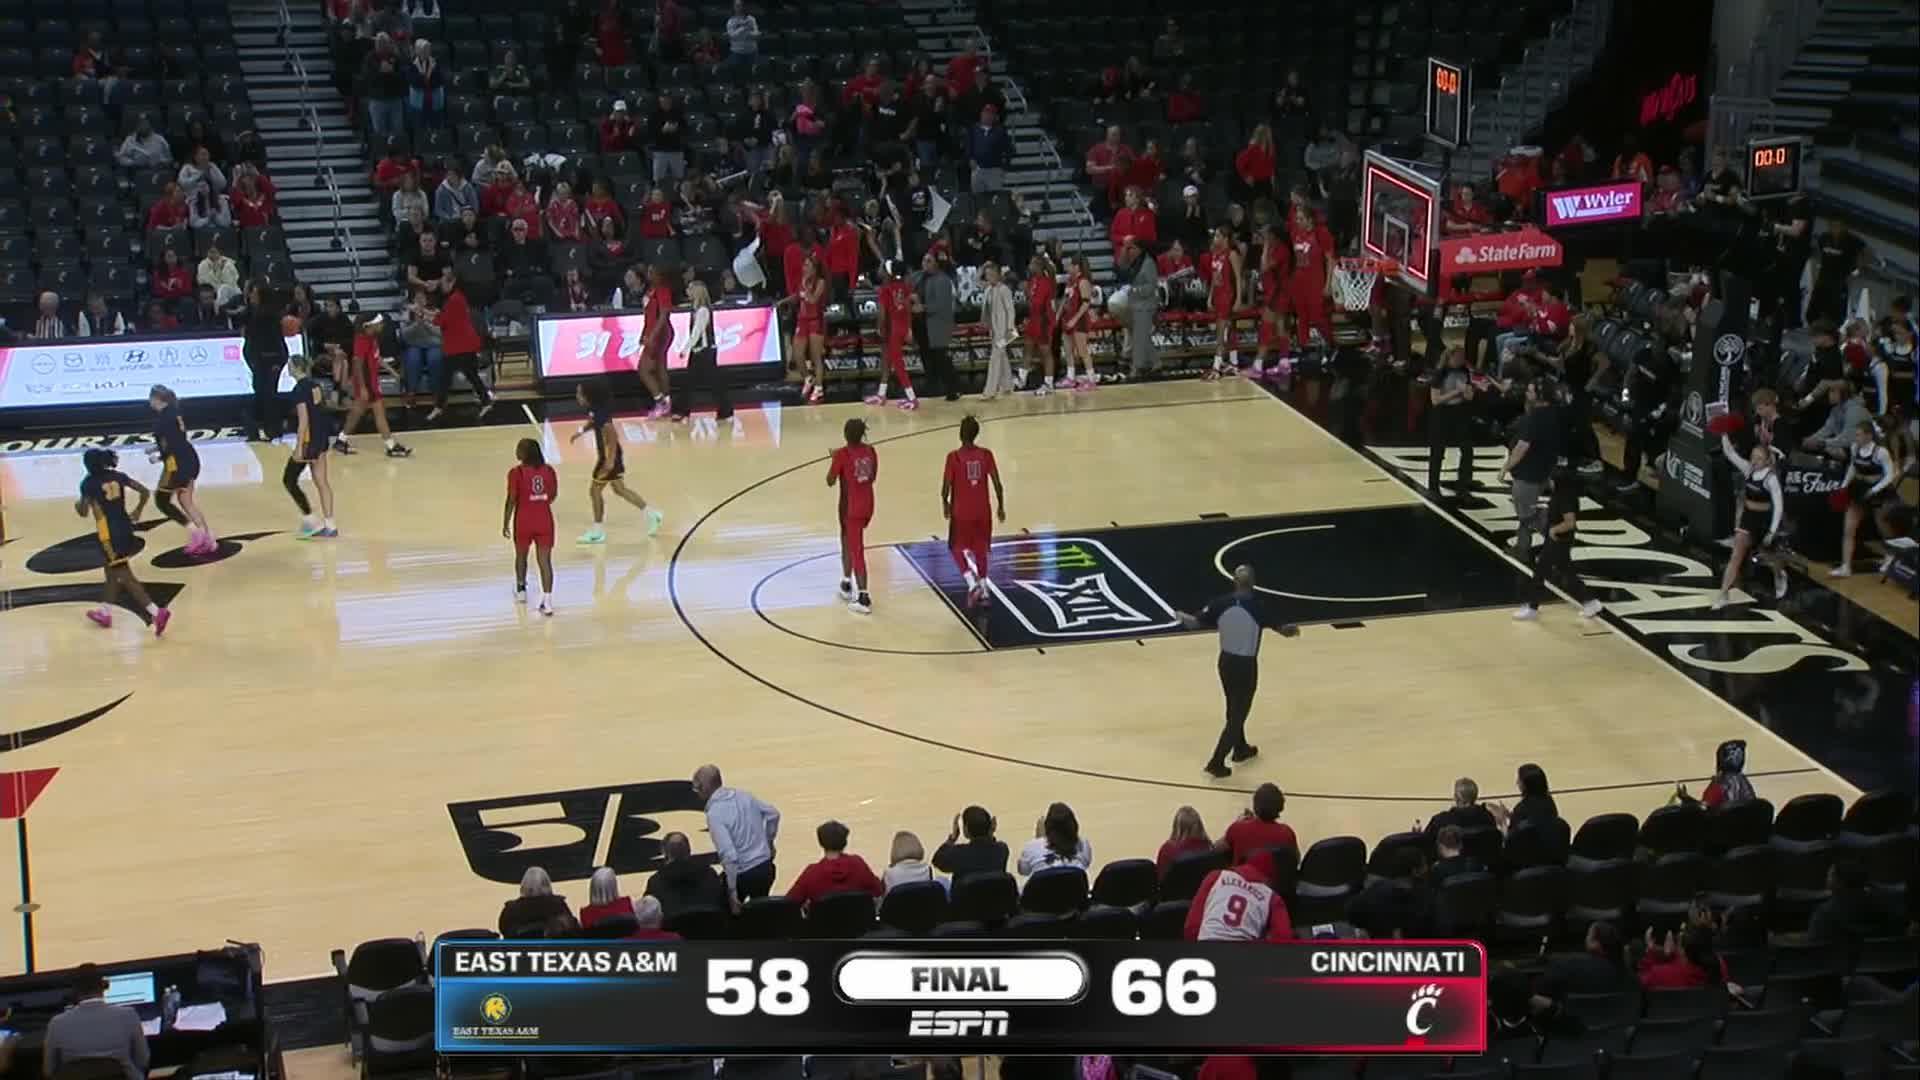
CIN 66, UNLV 67
Spread and total: game
CIN +3.554%46%UNLV -3.5
CIN +2.552%48%UNLV -2.5
CIN +1.550%51%UNLV -1.5
CIN +0.547%53%UNLV -0.5
CIN -0.547%53%UNLV +0.5
O 129.555%45%U 129.5
O 131.552%48%U 131.5
O 133.549%51%U 133.5
O 135.547%53%U 135.5
O 137.544%56%U 137.5
1st half (score at halftime)
CIN +2.555%45%UNLV -2.5
CIN +1.552%48%UNLV -1.5
CIN +0.549%51%UNLV -0.5
CIN -0.547%53%UNLV +0.5
CIN -1.544%56%UNLV +1.5
O 62.560%40%U 62.5
O 64.556%45%U 64.5
O 66.550%50%U 66.5
O 68.545%55%U 68.5
O 70.541%59%U 70.5
From 10,000 simulated games.
| Players to watch | PTS | REB | AST | Chance |
|---|
| UNLVJasmyn Lott | 14.9 | 2.8 | 1.0 | 15+ 50% |
| UNLVMeadow Roland | 14.4 | 7.0 | 2.8 | 15+ 47% |
| CINCaliyah DeVillasee | 13.7 | 2.6 | 2.6 | 15+ 42% |
| UNLVJayla Constant | 11.8 | 4.1 | 3.4 | 15+ 28% |
| UNLVBergan Kinnebrew | 8.2 | 2.1 | 1.2 | 10+ 35% |
| CINJade Jones | 7.9 | 4.1 | 1.1 | 10+ 32% |
Cincinnati W simulated box score
| Player | MIN | PTS | REB | AST | STL | BLK | TO | FG | 3PT | FT |
|---|
| Caliyah DeVillasee | 30 | 13.7 | 2.6 | 2.6 | 0.9 | 0.1 | 1.6 | 4.7-11.5 | 0.8-2.9 | 3.4-4.8 |
| Jade Jones | 26 | 7.9 | 4.1 | 1.1 | 1.2 | 0.3 | 1.6 | 3.2-7.9 | 0.5-1.8 | 1.0-1.6 |
| Sahnya Jah | 19 | 7.3 | 4.3 | 1.2 | 0.8 | 0.8 | 1.6 | 2.5-6.7 | 0.7-2.5 | 1.7-2.4 |
| Joya Crawford | 18 | 5.6 | 2.4 | 0.5 | 0.4 | 0.0 | 1.1 | 1.9-5.1 | 0.6-2.0 | 1.3-1.8 |
| Dee Alexander | 18 | 6.5 | 4.6 | 0.4 | 0.5 | 0.3 | 1.0 | 2.1-5.0 | 0.3-0.9 | 2.1-3.4 |
| Naomi Benson | 17 | 4.7 | 7.0 | 0.9 | 0.3 | 1.2 | 0.9 | 2.1-4.9 | 0.1-0.4 | 0.4-0.6 |
| Amber Bullard | 17 | 6.1 | 6.7 | 0.1 | 0.2 | 0.6 | 1.5 | 2.1-4.7 | 0.1-0.4 | 1.7-2.5 |
| Reagan Jackson | 16 | 4.2 | 2.1 | 0.9 | 0.3 | 0.0 | 0.7 | 1.4-4.0 | 0.5-1.7 | 0.9-1.2 |
| Jaidyn Gunter | 16 | 4.0 | 0.7 | 1.5 | 0.8 | 0.1 | 1.1 | 1.3-3.7 | 0.5-1.6 | 0.9-1.3 |
| Marta Fernandez | 15 | 3.7 | 0.9 | 2.5 | 1.0 | 0.0 | 2.0 | 1.4-3.6 | 0.4-1.4 | 0.5-0.8 |
| Mary Carden | 5 | 1.2 | 1.1 | 0.1 | 0.1 | 0.0 | 0.2 | 0.5-1.2 | 0.1-0.4 | 0.1-0.2 |
| Kali Barrett | 5 | 1.1 | 0.8 | 0.1 | 0.0 | 0.0 | 0.5 | 0.5-1.2 | 0.1-0.4 | 0.1-0.1 |
| Team | 200 | 66.0 | 37.3 | 11.9 | 6.5 | 3.4 | 13.8 | 23.7-59.5 | 4.7-16.4 | 14.1-20.7 |
UNLV W simulated box score
| Player | MIN | PTS | REB | AST | STL | BLK | TO | FG | 3PT | FT |
|---|
| Jasmyn Lott | 37 | 14.9 | 2.8 | 1.0 | 1.4 | 0.2 | 2.4 | 4.6-11.9 | 1.5-4.9 | 4.1-5.6 |
| Jayla Constant | 33 | 11.8 | 4.1 | 3.4 | 0.0 | 0.0 | 0.2 | 4.3-11.8 | 1.4-4.8 | 1.8-2.5 |
| Meadow Roland | 30 | 14.4 | 7.0 | 2.8 | 1.2 | 2.1 | 1.5 | 4.7-11.8 | 1.0-3.3 | 3.9-5.7 |
| Norah Moo | 25 | 4.5 | 7.8 | 0.9 | 0.1 | 0.2 | 2.5 | 1.7-3.9 | 0.2-0.7 | 0.9-1.3 |
| Marley Washenitz | 23 | 7.2 | 3.5 | 1.8 | 1.9 | 0.1 | 1.3 | 2.6-7.1 | 1.0-3.4 | 0.9-1.2 |
| Trystan James | 23 | 5.1 | 5.2 | 0.2 | 1.3 | 0.0 | 2.2 | 1.8-4.6 | 0.5-1.6 | 1.0-1.6 |
| Bergan Kinnebrew | 22 | 8.2 | 2.1 | 1.2 | 1.3 | 1.1 | 0.5 | 2.2-6.0 | 0.8-2.6 | 2.9-4.0 |
| Keonni Lewis | 7 | 1.4 | 0.3 | 1.3 | 0.3 | 0.0 | 1.2 | 0.5-1.4 | 0.2-0.5 | 0.1-0.2 |
| Team | 200 | 67.5 | 32.8 | 12.6 | 7.5 | 3.7 | 11.8 | 22.4-58.5 | 6.6-21.8 | 15.6-22.1 |
Every possession played out from each team's shooting, turnovers, rebounding and pace and each player's minutes and usage, 10,000 times. Early season: leans on last season until teams have a few weeks of games.
Embed this Sim on your site


 CINUNLV





















 CIN
